• Home
  • Products
    • TunerStudio MS
      • Registered TunerStudio Advantages
      • TunerStudio Articles
    • MegaLogViewer
      • MegaLogViewer HD
    • Shadow Dash MS
      • Requirements
    • TS Dash
    • Connectivity
  • Support
    • FAQs
    • Manuals
      • Developer Manuals
    • MegaSquirt Forums
    • How To Videos
    • User Reviews
  • Downloads
    • TunerStudio Change Log
    • MegaLogViewer Change Log
  • Editors
    • Login
  • About EFI Analytics
  1. Home
  2. Products
  3. TunerStudio
  • Home
  • Products
  • Support
  • Downloads
  • Editors
  • About EFI Analytics

TunerStudio

Automatic Logging

Available in TunerStudio 2.3+ and Shadow Dash 1.16+


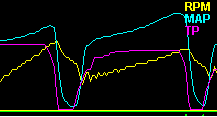
Want to start logging when you foot goes down to capture every wide open trip?

May you want to stop logging when the engine shuts down, now you can set this up with basic simple triggers or if you aren advanced user you can make the conditions as complex as your heart desires.


Set any conditions to start and stop data logging.
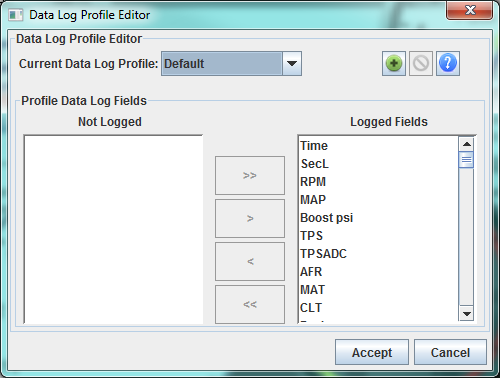
 

Automatic Logging:

The automatic logging feature allows you to set up logging to automatically start and stop when conditions you define occur.

auto loging enable

Auto Logger Setup :

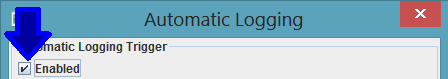
To set up the auto log feature go to the "Data Logging" drop down menu and click
on "Automatic Logging"  . Once the automatic logging dialog is open you will

need to click on the Enable box at the upper left hand corner .


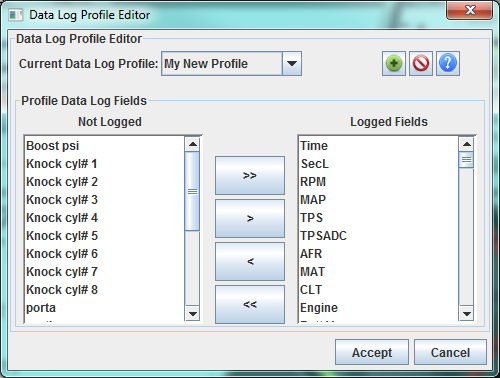
You can set up the auto logging feature many different ways.
The simple method has a drop down menu with a very log list of optional engine
parameters to choice from . Once you have picked which engine parameter you
would like to trigger your data logging you can then pick from a list of three options  .

    "Engine Parameter"  >  grater than your entered value .

    "Engine Parameter"  =  equal to your entered value .

    "Engine Parameter"  <  less than your entered value .

If you want to make a custom condition that will turn your logging on or off
then you can select the "Expression" option and enter a equation .

auto loging window


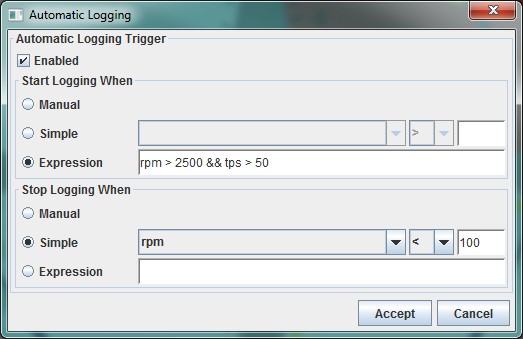
EXAMPLE : If you want to start logging with a engine RPM over 2500 and a TPS
position over 50% then you would use this formula rpm < 2500 && tps < 50.

If you choose your start logging parameters as automatic but leave your stop
logging in manualmode then it will start once your engine reaches your set
parameters and stay logging until you shut it of manually or shut the engine off .

Data Log Profiles

Data Log Profile: By default when you data log all fields defined by the firmware developers are included in your data logs. For most typical tuning, data logging the complete set of fields is fine and insures the broadest set of data fields is available for later review. However you may choose to data log only a subset of the available fields in order to achieve a faster data rate* or decrease disk usage. Data Log Profiles provide you with this ability.

*With many older firmware, Logging a subset of fields will not improve data rate because retrieving all runtime data in every read is the only model supported. However with firmwares that support partial runtime reads you will achieve higher data rates.
 - MS2 Extra version 3.3+ (with CAN_COMMANDS On)
 - MS3 1.3+ achieves substantially higher data rates.

Creating and Editing Data Log Profiles data
From the Main Menu select:
Data Logging --> Data Log Profiles

datalogProfiles DefaultProfile

The Default Data Log Profile includes all fields and they will be displayed on the right under "Logged Fields". This is a special profile that is not user ediable.

Creating a Data Log Group - By Clicking on the Add Data Log Profile Button (+), you will be prompted for the name of your new profile.

datalogProfiles NewProfileName

Once entered, it will appear in the drop down at the top.

Initially the fields will look the same as the Default Profile, however they will now be editable.


datalogProfiles NewProfile


You may remove fields moving them to the left hand "Not Logged" list using the < or << buttons or add the back to the logged list with the > or >> buttons

To delete a Logging Profile; click the datalogProfiles DeleteProfile Button.

With multiple profiles you may switch between them and edit them while the dialog is open. All changes will be save when you click Accept.

Important: When you close the dialog with the accept button, the selected profile will be used for logging sessions within that project.

High Speed Logging

mlv

In the past the when reading runtime data each call to the MegaSquirt returns an update for every defined output channel supported by the firmware whether it was being used or not. Instead of doing this, Tunerstudio 2.3 and Shadow Dash MS 1.16+ will read only the data that is needed provided the firmware supports partial reads. This can potentially give dramatic increase to your maximum data rate. Once again MS3 and MS3-Pro have the best support including the new protocol extensions in the 1.3 firmware so you can capture data logs at over 100 records per second! This is to your laptop or phone, without even using the SD logger.


Firmware support is required!

There are 2 models used:

  1. TunerStudio breaks reads into chunks to only read what data is needed. This causes multiple small reads that improves performance in most circumstances.
  2. New Protocol Extensions allow TunerStudio to read only the needed data in a single call. This is best and gives the best performance possible at 115200 baud.

MS2Extra version 3.3+ and MS2 B&G 3.83+ use method 1 and can achieve 75+ records per second. Important! In MS2 you must enable CAN_COMMANDS in project properties

MS3 version 1.3+ also enables method 2 enabling logging at over 100 records per second!


To achieve the fastest data rates you will want to use Data Log Profiles to log the subset of data you want and need.


WarmUp Enrichment Auto-Tune

WarmUp Enrichment (WUE) Analyze Auto-Tune

Available in TunerStudio 2.2+!

WueAnalyzeSm

Overview:

Tuning of Warmup carries some challenges that are somewhat different from the tuning your fuel tables. Where as when tuning your fuel tables you can collect data, make changes and observer the impact of those changes then readjust if needed,  with warmu up enrichment you only get one try a day. Once it is warmed up, you probably don't get to start off with a completely cold engine again until tomorrow, even then how cold depends on your weather. This is what makes Warm up Enrichment (WUE) Tuning an ideal candidate for auto tune. Your laptop can capture all the data needed to dial in your WUE in as little as 1 to 2 passes.

You may first want to familiarize yourself with the available settings in case you do need them, the default setting should work fine in the majority of cases.
Then go to the Using WUE Analyze section for the simple steps to have WUE Analyze correct your WUE.


Primary Controls:
WueAnalyzeControls

  • Update Controller checkbox - (Only Available on some firmwares such as MegaSquirt 3.) When checked, WUE Analyze will update the controller periodically with the recommended values. It will act as if you are pressing the Apply button.
  • Apply Button - When clicked, the recommended values will be written to the controller. When using firmwares that do not support Update Controller, Burn must then also be clicked for the new values to take effect. For WUE Analyze, this is typically only used when you have completed the warm up cycle or if you want to apply the recommended values after your ECU has been power cycled.
  • Burn / Save on ECU Button - This signals the Controller to persist the values in RAM to Flash so they are stored for use after the controller is power cycled. When values are written to RAM, but not flash, however once the controller is power cycled they are lost and the values will be loaded from Flash. So this button should be clicked when you are finshed and what to keep you values.
  • Start / Stop Auto Tune Button - Activates and deactivates WUE Analyze.

Display:
WueAnalyzeDisplays

This curve graph has 2 lines to display the current controller warm up enrichment settings and the generated recommended settings:

  • Yellow Line - Represents what is currently in the controller. This is the WUE settings the engine is currently running on.
  • Blue line - Represents the recommended WUE curve that will be applied upon completion.

You will at some point also see dashed lines. They show the original position of these curves when the WUE session 1st began.


WUE Analyze Stats:
WueAnalyzeStats

  • Various information is displayed to show data being collected and how much data is being filtered. Take note of the Active Filter, when a data filter is on, it will display what one in yellow to help bring it attension. While there is a filter lit in yellow, WUE analyzer is skipping the data that is currently being captured.


Scatter Plots:

wueErrorScatterPlot   wueRecommendScatterPlot


The scatter plot provide a visual representation of the data being collected.

  • WUE Error vs Coolant - The percent error in target AFR is displayed through out the temperature range..
  • Recommended WUE Data - Displays the calculated recommended WUE through out the temperature range.


Advanced Settings:
wueAdvancedSettings

  • AFR Temperature Adjustment to Lambda - For most less radical engines targeting your standard stoich AFR is desireable. However, for various reasons you may want the engine to run more or less rich during warmup. Adjusting this curve allows you to raise or lower the target AFR during warmup. By Adjusting the curve down, the target AFR for that temperature will be lowered. For example if your target AFR at 32 degrees is 14.7:1 under normal condition and this table is set at -0.5, WUE Analyze will use 14.2:1 as the target AFR.
  • High Throttle Filter - Sets a throttle threshold to filter data over. By default set to 15, so any throttle position over 15% will be filtered during a WUE Analyze Live session.
  • Custom Filter - Allows you to set any valid expression that will filter additional input data.
  • AFR Targets - Opens or select what AFR target Table to use. By Default your normal running AFR table is used, but you can set this to a different one or custom TunerStudio table.
Filters:
  • High Throttle Filter - Sets a throttle threshold to filter data over. By default set to 15, so any throttle position over 15% will be filtered during a WUE Analyze Live session.
  • Custom Filter - This allows the flexibility to create and apply any formula or mathematical expression using any outputchannels you wish to set conditions to filter VE Analyze input data.
Reference Tables:
  • AFR Targets - Opens or select what AFR target Table to use. By Default your normal running AFR table is used, but you can set this to a different one or custom TunerStudio table.


Using WUE Analyze Live:
Operation of WUE Analyze should begin with a cold engine. If it is not that cold this time of year, not to worry, you can use it on the warmup from what ever temperature it is and perhaps come back to it when the weather turns cooler.

To begin using WUE Analyze Live:
  1. Power on your ECU
  2. Connect TunerStudio, and go to the WUE Analyze Screen by clicking on the "Tune Analyze Live - Tune For You" tab. There will be a sub tab for WarmupEnrichment1, select that.
  3. On the Warm up Enrichment Analyze tab, go ahead and click "Start Auto Tune". There will be steady active filters until the engine is started, so it will not begin processing the data.
  4. Now proceed to start your engine.
  5. Important! - Once your engine is running, try to maintain a steady RPM through the warmup process. Normally idle is good, but if you have an engine that does not yet want to idle while cold, hold the engine at a steady RPM from 1500 to 2500 RPM.
  6. Wait and watch. See what changes are recommended until it gets up to running temperature.
  7. Once the engine is warmed up, Do not turn off the engine. Review the recommendation to insure it appears correct. Then Click "Stop Autotune", then Burn.
  8. After Burn is clicked, the new Recommended WUE is saved to your ECU and you can turn off the engine. Try out your new WUE settings on the next warmup

Contexual Help

contextHelp


Contextual Help support has been added throughout TunerStudio. Anywhere you see a contextHelpButton, you can view help instructions added by the firmware developers in a tooltip by holding the mouse over it. If you click on the contextHelpButton a yellow box like above is displayed for easier reading.


Note: As the vast majority of settings are specific to your firmware, TunerStudio only contains Context help for core fields. Most Contextual help is part of the firmware definition, so the level of available contextual help is best in current firmwares. James Murray has included very complete Contextual help in the MS3 1.3 ecu Definition files.

  1. Dashboard Enhancements
  2. USB & WiFi Support
  3. Setting Search
  4. TunerStudio 3.0 Curve Editor

Page 3 of 7

  • 1
  • 2
  • 3
  • 4
  • 5
  • 6
  • 7
EFI Analytics, Inc © 2023